
|
The HaloPlex Exome Agilent Catalog design provides comprehensive coverage of the coding regions of the human genome. As part of the development of this design, Agilent has performed sequencing on HaloPlex Exome enriched DNA, generating a BAM file of the actual sequencing data. For advanced custom designs that you created by selecting a subset of probes from the HaloPlex Exome Agilent Catalog design, SureDesign can provide a simulated BAM file based on the data in the actual Exome BAM file. The simulated BAM file contains only the reads from the Exome BAM file that correspond to the subset of probes in the custom design. In addition to the simulated BAM file, SureDesign generates an index file to allow you to view the BAM file in IGV. You can also view it in Agilent SureCall.
NOTE Not all HaloPlex designs created with the advanced wizard are eligible for the simulated BAM file. See the table below for details.
The Exome BAM file that serves as the source of the reads in the simulated BAM files was generated on an Illumina HiSeq 2000 at 100 bp. The reads were then aligned using the default analysis method in SureCall version 1.0, which uses the Burrows-Wheeler Aligner.
The simulated BAM file enables you to preview how your custom design may perform. You can import the simulated BAM file into SureCall (or another sequence analysis tool) to view the sequencing reads and QC metrics, walk through the steps of data analysis, and even generate an example mutation report. Because you can request the simulated BAM file before you finalize the custom design, previewing the design's potential performance allows you to further optimize your design before you finalize it.
Table: Designs that are eligible for a simulated BAM file
Design parameter |
Selection |
Application |
HaloPlex |
Platform |
Illumina |
Read length |
100 bp, 150 bp, or 250 bp (BAM file reads are from 100 bp sequencing) |
Content Addition Method |
Select probes from an existing Design or Probegroup > Select probes for specific genes or regions OR Select probes from an existing Design or Probegroup > Select probes by Amplicon ID (These methods are only available in the advanced wizard) |
Probe source |
HaloPlex Exome (in the Agilent Catalog workspace) |
*All probegroups in the design must have these parameters in order for the design to be eligible for a simulated BAM file.
To test how accurately the simulated BAM file predicts the number of reads per amplicon in an actual sequencing experiment, a custom HaloPlex design was used for target enrichment in duplicate sequencing assays to generate two experimental BAM files (one for each replicate). The custom design used for this experiment is approximately 95 kb in size and consists of a subset of probes from the HaloPlex Exome Agilent Catalog design. After normalization of the sequencing data (to equalize the amount of sequencing), the read depth for each amplicon was compared between the experimental and simulated BAM files and between the two replicate experimental BAM files. The scatter plots for the comparisons are shown in the figure below.
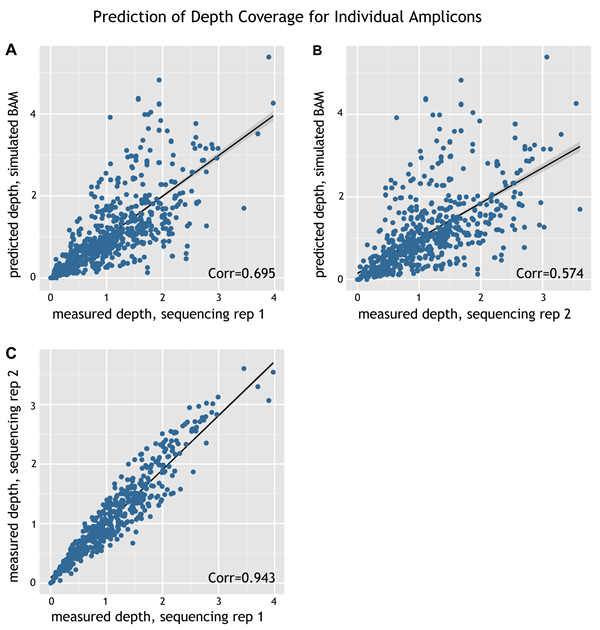
Figure: Prediction of depth coverage for individual amplicons. Panel A: Plotted on the x-axis are the measured read depths for individual amplicons of a custom design based on the experimental BAM file for replicate 1 of the sequencing assay. Plotted on the y-axis are the predicted read depths for the same design based on the simulated BAM file. The R2 value for the correlation is 0.695. Panel B: Plotted on the x-axis are the measured read depths for individual amplicons of a custom design based on the experimental BAM file for replicate 2 of the sequencing assay. Plotted on the y-axis are the predicted read depths for the same design based on the simulated BAM file. The R2 value for the correlation is 0.574. Panel C: Plotted on the x-axis are the measured read depths for individual amplicons of a custom design based on the experimental BAM file for replicate 1 of the sequencing assay. Plotted on the y-axis are the measured read depths based on the experimental BAM file for replicate 2 of the sequencing assay. The R2 value for the correlation is 0.943.
When comparing the experimental and simulated BAM files, the correlation values are 0.574 (replicate 1) and 0.695 (replicate 2). These values suggest that you can use the simulated BAM files for guidance on the potential overall performance of a custom design, but not necessarily to predict performance of an individual amplicon.
To submit a request for SureDesign to generate a simulated BAM file for your advanced HaloPlex design:
Open the design in the details window.
Near the upper right corner of the window,
click BAM. (The BAM
button is also available in the summary panel of the HaloPlex
advanced wizard after you have added content to the design.)
A message box opens indicating the e-mail address where Agilent will
send the link to download the BAM file. If desired, you can enter
additional e-mail addresses into the provided field.
Click OK
in the notification message to submit the request.
You receive an e-mail from Agilent SureDesign when the BAM file is
ready. Click the link within the e-mail to download a compressed folder
(*.zip) that contains the BAM file and the accompanying index file.
The link in the e-mail remains active for one week. If you do not
download the BAM file within a week, you will need to submit another
request.
NOTE Anyone with access to the
link can download the BAM file. No SureDesign login is required.