Frequently Asked Questions (FAQ) |
|
The eArray Frequently Asked Questions are organized into these sections:
Custom Gene Expression Microarrays
How many probes can I upload to eArray at a time?
Currently, Agilent recommends that you upload no more than 200,000 probes at a time. The more probes you upload, the longer it takes for them to appear in your account. If other users submit probe uploads before you do, you can wait even longer before your upload begins.
What is the purpose of the Agilent control grid on an array?
Agilent control grids contain three categories of controls: 1) Positive controls that, depending upon application type, show predictable signal intensities. Positive controls include spike in (e1A) controls and endogenous target (housekeeping) controls; 2) Negative controls that are designed to show no signal after hybridization, and are used as part of the background subtraction algorithms; and 3) Manufacturing controls that Agilent uses for quality control, and to troubleshoot arrays that do not perform as expected.
How many features do I have available to me on an array?
The number of probes available on each array depends upon the application type, array format, and target species. To determine the number of probes available on an array, you can use the Array Calculator.
Can I omit the control grid for my array?
No. Except for the SureSelect Capture Array application type, all microarrays require a control grid. The specific grid depends on the application type, the array format, and, for CGH, ChIP, and microRNA applications, the target species.
I have registered in eArray, but I cannot log in to my account. Why?
When you submit a registration request, you complete the first step in the registration process. Your account must also be approved and enabled. See How do I register.
I have uploaded probes into the system. Why is it taking so long to see them in my workspace?
Depending upon the number of users of the system, and the number of probes that you submit, it can take up to several days to upload probes into your workspace. Occasionally, the probe set you upload generates an upload error. If your organization's IT department blocks e-mails that contain .zip files, you may not receive the error reports, and as a result, may be unduly waiting for the upload process to finish.
If I want to design a non-randomized array, how do I do this?
Agilent does not recommend the creation of non-randomized arrays. However, in keeping with Agilent's commitment to "print what you want," you can accomplish this during the array creation process. When you specify design parameters for your microarray, you select Customer Specified in Feature Layout. Before you submit the design to Agilent, you download a resource file that contains all of the probes to be placed on the array. After you place the probes in the desired order, you upload the file to eArray. This creates an ordered layout. See Provide feature order.
Can I design a CGH array that has probes that cover specific genomic intervals of interest?
Yes.
1. You can search the CGH HD database for probes in specific intervals of interest. You can retrieve all probes in the specified intervals, or a specific number or density of probes. See How to do a High Density (HD) Search.
2. You can use the Genomic Tiling tool to generate probes to genomic intervals that you define. See About Genomic Tiling.
No. If you download catalog probes, and re-upload them, the system recognizes them as new probes in your account. If you create a subset of catalog probes with off-line tools, use the Search Standard Probes tool to select the subset in eArray. This lets you search for probes by probe ID, and then save the returned probes as a probe group.
What are the attributes of probes that can be uploaded?
In addition to probe ID and sequence, target IDs, multiple accession numbers, gene symbols, a description line, and a chromosomal location can be assigned to a probe, using the complete probe upload file format. See Probe file formats and requirements for uploading.
Why do you specify species in eArray? What does it affect?
You specify species in eArray for several reasons:
It provides another variable that can be used as a search criterion when you search for content.
For the CGH, ChIP, and microRNA application types, the required Agilent control grid is species-specific.
Certain tools, such as Genomic Tiling, GE Probe Design, Simple Tiling, and Bait Tiling (for both SureSelect Target Enrichment and RNA Enrichment), are species-specific. Also, not all functionality is available for all species.
If your organism of interest is not available, select NA as the species in the appropriate lists. To add your organism to the species database, submit a request through technical support. If you choose this route, do not upload your probes as NA.
Why would I want to use a linker?
Linkers move probes farther away from the glass microarray substrate in order to reduce steric hindrance. Within eArray, you can apply linkers to probes that are less than 60 nucleotides long to increase the biological availability of the active probe.
For example, if you have 25mer probes, you can add a linker that stilts them to be 40mers, making the 25mer sequence more available for duplex formation. eArray applies the linker to the 3' end of the probe. Derive the linker sequence from a sequence that is not found in nature, or is random. Agilent provides a default linker sequence that you can use for this purpose.
Does the eArray probe design algorithm take into account phred scores? (Poor middle reads)?
No. eArray does not accept phred scores as part of the probe design process. (Phred scores are indicators of the quality of sequence calls in DNA sequencing.)
Not at this time. However, customers have anecdotally reported great success using Agilent's computationally generated probes to define and solve biological problems.
How often does Agilent update annotations in eArray?
Agilent updates annotations in eArray every 3-4 months.
Does eArray support browsers other than Internet Explorer?
eArray also supports Firefox on Mac OS X and on Windows. See the System Requirements.
What is a rational approach to creating CGH Probe Groups?
The content of an Agilent microarray is defined as the union of the Probe Groups it contains. During the creation of a custom microarray content is added by associating it with one or more Probe Groups. These Probe Groups can either be preexisting or created on the fly using eArray’s Design Wizards. A Probe Group consists of one or more probes assigned to a group. Probes can exist in more than one Probe Group.
It may be useful to split regions (e.g., regions designed to address different disorders or regions with different probe densities) into separate Probe Groups, considering possible mix-and-match adjustments in future array designs. If you want to have a set of probes that will be replicated or used as normalization probes then these need to be in a separate Probe Groups. Probe Groups can be created in multiple ways:
(Strongly recommended) By searching the Agilent HD-CGH database, a high-density database of predesigned probes
By uploading your own probes
By searching your own probes or Probe Groups
By ‘Genomic Tiling’, i.e., designing probes at a precise spacing
This needs to be done through different, iterative searches. For each search a different Probe Group will be created, the microarray is then designed by combining the different Probe Groups. Once all of the Probe Groups are created, an array calculator is available on the Microarray tab to help calculate which array format makes the best sense for the given number of probes. There are utilities available under the Probe Group page to compare Probe Groups and remove duplicates in different Probe Groups.
The minimum number of probes depends on the size of the aberration, the number of probes preferred (e.g., 1, 2, 3 or more) to make an aberration call, and the overall noise of the experiment. A good measure for overall noise of an Agilent aCGH experiment is the QC metric DLRSD (derivative log ratio spread, probe-to-probe log ratio noise), and this strongly correlates with DNA quality.
Regarding the maximum number of probes, putting more probes in a given region does not necessarily result in the ability to make smaller aberration calls. (See also Ylstra B et al. Nucleic Acids Research. 2006; 34(2):445–450) for a discussion on functional resolution of CGH experiments. First of all, if a very high-density design is created, it will surely contain probes that have lower scores. All probes in the Agilent HD-CGH database have a predicted performance score (based on Tm (melting temperature), GC content, a hairpin ΔG, sequence complexity, and metrics to measure homology with the rest of the reference genome). The eArray pair-wise reduction algorithm will pick the best HD probes based on the user-selected average HD probe spacing per interval or the total number of HD probes. In the case of a very high-density design, the pair-wise reduction algorithm will no longer be able to return the best HD probes but will return all or most available probes instead. See the FAQ "What is a CGH probe score?” for more information.
Moreover, very high-density designs might have negative consequences for hybridization. The standard Agilent protocol for DNA labeling yields labeled fragments with a size peak around 200 nucleotides. In the case of a very high-density design, probes on the array will compete for the same fragment for hybridization. Having too many probes in the small region will decrease the signal and might result in noisy data. Agilent does not recommend going lower than 150 to 200 bp spacing.
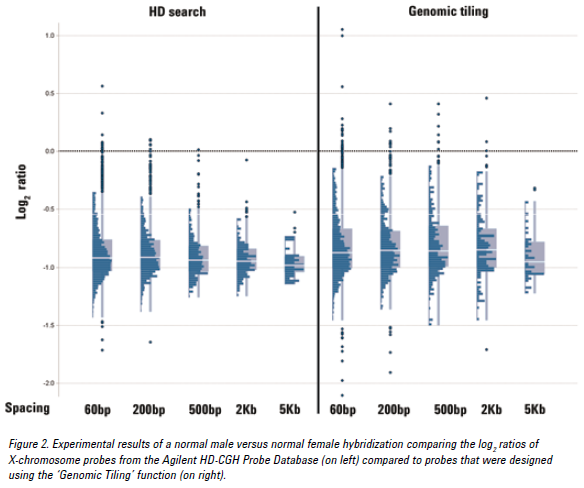
See the figure below for an example of CGH data from probes at various densities using either the HD search or Genomic Tiling. Probes selected from an HD search with up to 200 bp spacing provided log ratios very close to the expected value of -1.
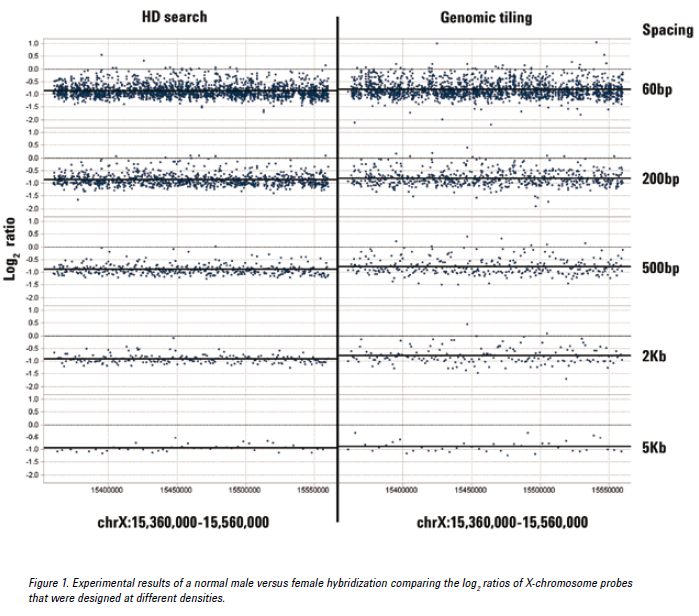
Overall, probes generated using the ‘Genomic Tiling’ function will perform more poorly than probes found in the Agilent HD-CGH Probe Database. Agilent very strongly recommends using the Agilent HD-CGH Probe Database and not the ‘Genomic Tiling’ option. Only for regions where there are not enough HD probes available in the database should ‘Genomic Tiling’ be considered.
All HD probes in the database (except for probes in regions in which no optimal Tm probes exist) have been Tm matched and have a predicted performance score (based on Tm, GC content, a hairpin ΔG, sequence complexity, and metrics to measure homology with the rest of the reference genome). The eArray pair-wise reduction algorithm will pick the best HD probes based on the user-selected average HD probe spacing per interval or the total number of HD probes.
Additionally, during design the HD probes have passed a Tm filter, are annotated such that a user can choose between different similarity filtering options (non-unique probe filter, perfect match filter, or similarity score filter), and if there are catalog probes present in search results they can be preferentially selected. In contrast, using eArray’s ‘Genomic Tiling’ feature probes are picked at a fixed spacing and there is no chance to Tm balance or optimize probes selected for by performance. Probes created should perform no better than those picked at random. The only options to improve probe performance are probe trimming and skipping of repeat masked regions.
See the figure below for an example of CGH data from Agilent HD-CGH probes compared to ‘Genomic Tiling’ probes. The median log2 ratios of the HD-CGH probes are closer to the expected value of -1 with a smaller spread when compared to the ‘Genomic Tiling’ probes.
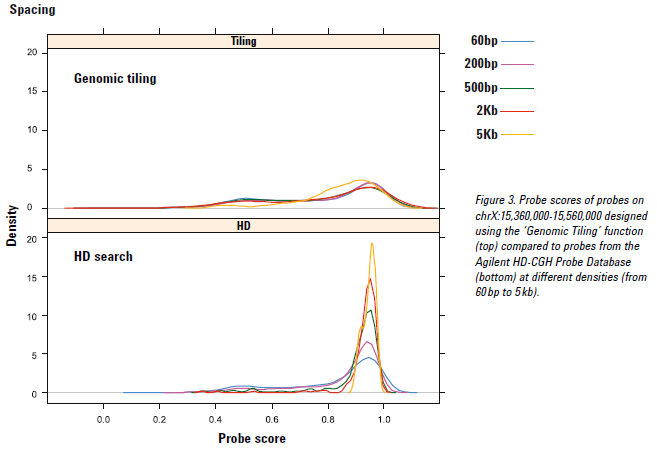
Every probe in the Agilent HD-CGH Probe Database has a probe performance score with a value between 0 and 1. The higher the score, the greater the likelihood that a probe will produce a good log ratio response when it is included on an Agilent CGH microarray. The probe score generated by eArray is based on a statistical model that was constructed by regressing in silico parameters for the probe sequence against an observed log ratio response in a model system. The parameters used include Tm, GC content, a hairpin ΔG, sequence complexity, and metrics to measure homology with the rest of the reference genome. This probe score is a prediction of the response of the particular probe in log ratio space. The response is defined as observed over expected log ratio. The average probe score for all probes in the HD database is 0.759, the average probe score for the Agilent catalog array AMADID 021529 (SurePrint G3 Human CGH Microarray 1x1 M) is 0.917.
You can obtain scores from eArray for custom probes (e.g., probes designed using the ‘Genomic Tiling’ function). To do this, submit a probe scoring job (Under “Probes”, “Score Custom Probes”). During the custom probe scoring, all metrics described above are computed and plugged into the model to generate the probe score. Once the probe scoring job completes the CGH probe scores will be available in a download from the probe scoring job or by downloading the tdt file from the Probe Group. Low scoring probes can then be filtered outside of eArray by downloading the Probe Group with the scores and making a list of probe IDs that pass your score threshold. That list can be used to search probes in your eArray folder and create a new Probe Group. In DNA Analytics (part of Genomic Workbench 6.0 or higher), probes can be filtered by probe score if the probes used to create the design have been scored.
See the figure below for the probe scores of probes from the Agilent HD-CGH Probe Database compared to probes that were designed using the ‘Genomic Tiling’ function. As expected the distributions of the probe scores returned from genomic tiling are very similar. This is because genomic tiling does not consider probe scores when picking probe sequences. An HD search on the other hand uses an algorithm that will select probes uniformly at the requested density while using the performance scores to keep the better scoring probes.
When designing CGH microarrays, how can I avoid GC-rich, high-Tm or repeat regions?
For probes selected using
the Agilent HD-CGH Probe Database:
All HD probes in the database have been designed to avoid repeat
masked regions, are Tm matched
(except for probes in regions in which no optimal Tm
probes exist) and have a predicted performance score (based on
Tm, GC content, a hairpin ΔG,
sequence complexity, and metrics to measure homology with the
rest of the reference genome). The eArray pair-wise reduction
algorithm will pick the best HD probes based on the user-selected
average HD probe spacing per interval or the total number of HD
probes. Additionally, HD probes can be filtered using a Tm filter, similarity filter (non-unique
probe filter, perfect match filter, or similarity score filter),
or catalog probes can be preferentially selected.
For probes selected using
‘Genomic Tiling’:
Probes in GC-rich, high-Tm,
and repeat regions can be very problematic. The only options in
‘Genomic Tiling’ are probe trimming and skipping of repeat masked
regions. The new probe set can be further improved by filtering
out high-Tm or GC-rich probes.
Tm and GC% can be obtained
from eArray by using the Score Custom Probes utility under the
Probe tab. A probe search using the passing probe IDs can then
be used to create a new Probe Group.
When ‘No Filter’ is selected any probe may be selected, regardless of similarity to other genomic sites. Keep in mind that data from “non-unique” probes will be harder to interpret, and it can be beneficial to limit the maximum number of perfect genomic hits by using the Non-Unique Probe Filter option.
When the Perfect Match Filter (or when the maximum number of perfect genomic hits is set to 1 in the Non-Unique Probe Filter) is selected, probes with more than one perfect match to the genome are excluded and as a result it will not be possible to find probes in Segmental Duplication or Pseudo-Autosomal Regions (PAR).
The Similarity Score Filter is the most stringent filter. This filter excludes probes with significant similarity to other sites in the genome and there will be genomic regions where no probes can be found.
In the CGH HD Probe Search, how do I target exons only, not just genes?
Using the Include Regions and selecting Exonic will limit the probes returned to those marked as overlapping exons only. This will work when searching by genomic intervals or gene annotations (transcript and gene identifiers). The designer should be aware that exons typically are more GC-rich than the rest of the genome, these probes, in general, will have a lower probe scores. See the FAQ ”What is a CGH probe score?” for more information. Using this “Exonic” approach there is no possibility to select the nearest probes in introns instead.
Identify the coordinates for the exons outside of eArray and use them as Genomic Intervals to select probes in. Then with the “Extended Interval Boundary” option in eArray the Genomic Intervals can be extended beyond the exon boundaries with a selected number of base pairs. Here are the instructions on how to identify coordinates for exons in UCSC.
Using the Table Browser utility from the UCSC genome browser, make sure the proper species and genome build are selected from the drop-down lists. It is important that the build matches eArray. For “track”, select desired gene definition track, Agilent recommends “CCDS”, “RefSeq Genes”, or “UCSC genes”. Follow the UCSC instructions on how to restrict the search. Options include filtering on genomic regions or track identifiers (names/accessions). Make sure the output contains chrom, exonStarts and exonEnds. This will give you all of the exon coordinates for the regions you defined.
To input these locations into an eArray HD Probe Search, split the line into pieces (one for each exon) and adjust the start coordinate (the output is 0-based, eArray expects 1-based). The orientation (i.e., strand information) does not matter in an eArray probe search. For example, the following line defining three exons (chrom; exon count; exon starts; exon ends):
chr1; 3; 2450045, 2451144, 2451409; 2451048, 2451310, 2451544
Can be converted to the format needed in eArray.:
chr1:2450046-2451048
chr1:2451145-2451310
chr1:2451410-2451544
The Standard HD Probe Search allows you to search for probes based on chromosomal location, allows you to apply filters and allows you to set the desired probe spacing across all intervals. The result of a Standard HD Probe Search will be a balanced probe density across the different intervals. In an Advanced HD Probe Search, filters and number of probes need to be set for each interval separately. Probes will be selected independently for each interval, even when intervals overlap. An Advanced HD Probe Search takes more time and the probe density in the different intervals will be different.
What is a CGH control grid and which probes does it contain?
A control grid is a set of control probes that are added to every array design. For every Agilent microarray design format and species there is a default species specific control grid suggested in eArray. These grids contain positive controls probes designs against endogenous sequence. Positive controls can be used for image orientation and to assess whether the sample was labeled. The “genomic” control grids are generic grids that contain only negative controls. Since they lack endogenous positive control probes they can be used for any species. The negative control probes are used to measure on element background. Here are some of the probe types you should expect to find on a species-specific genomic control grid.
BrightCorner (e.g., HsCGHBrightCorner)
Used for orientation purposes. These probes are placed in the corners of the array with a different pattern for each corner.
These probes are designed to endogenous sequence and are thus species-specific. These probes are predicted to have high signal due to the multiple copies found in the genome.
DarkCorner (DarkCorner)
Used for orientation purposes in the array corners. These, along with the bright corner probes, make up the corner-specific patterns.
These probes are the same as the 3xSLv1 probes described below.
Negative controls
Structural negative (3xSLv1)
Usually highly replicated on the array; used to measure on element background. This probe forms a hairpin and does not hybridize well with labeled sample of any species.
Biological negatives (e.g., NC1_00000002)
These are probes shown not to have significant signal from any sample tested. These probes are used to estimate on element background.
Currently there are 82 different negative control NC probes.
Common practice is to have one highly replicated NC probe (>100) and the other NC probes at lower replication (≈6).
Reserve negatives (e.g., SM_01)
There are currently 12 sequences replicated 40 times marked as control type Positive that are reserved negative controls for future potential use as positive controls. They do not show significant signal from any sample tested.
Positive controls
Biological positives (e.g., RnPC_10045851, PC_00000004)
Endogenous “species-specific” sequences predicted to have high signal, due to multiple copies found in the targeted genome, are used as positive controls. This is the same probe sequence used as the BrightCorner probe.
Common practice is to have this probe highly replicated.
Deletion stringency probes (e.g., DCP_008001.0)
Probes designed against endogenous “species-specific” sequence can be used to measure hybridization and wash stringency.
Approximately 20 probes, predicted to perform well by in silico metrics, are chosen randomly from a tiling database and printed on the array in triplicate. In addition, four variants of this probe are printed on the array, also in triplicate. The first variant has a one base pair deletion, the second a three base pair deletion, and the third has a five base pair deletion, and finally the fourth variant has a seven base pair deletion. Bases to be deleted are chosen at random from the center of the probe sequence. The number of bases deleted is indicated by the number after the period. For example, DCP_008001.0 and DCP_008001.3 are from the same parent sequence and the first probe has zero deletions while the second has three.
Intensity curve probes (e.g., SRN_800001)
Approximately two thousand species-specific probes are chosen to have predicted signals that span the practical signal space. These signal intensities are predictions made using an in-house model. These probes are generally not replicated.
These probes can be used in a non-linear normalization.
For CGH microarrays, when should I choose to append linkers?
For probes selected from the Agilent HD-CGH database, linkers are automatically added. For other probes, like probes generated through ‘Genomic Tiling’, Agilent recommends adding linkers in order to move the active probe sequences farther off of the array surface. This becomes more important for shorter sequences.
Why and when should I include normalization probes on CGH microarrays, and how many?
Normalization or ‘backbone’ probes should be included on a CGH microarray when it is expected that most probes are going to be in aberrant regions, such as a very focused design where half of the probes are on the X-chromosome. When designing a whole-genome array, though, it is not necessary to include specific normalization probes since there should be a sufficient number of non-aberrant regions for proper normalization. If you choose to include normalization probes, the minimum number of normalization probes is one percent of the microarray (Feature Extraction requirement) and the recommended number is at least several hundred probes. Each microarray design format has a default Agilent normalization Probe Group associated with it; see FAQ “What is the Agilent normalization Probe Group?” for more information.
Each microarray design format has a default Agilent normalization Probe Group associated with it. The Agilent normalization Probe Groups are biased away from probes in DGV (Database of Genomic Variants), but do not exclude all regions in DGV. If you want to exclude frequent aberration regions in common cancers, Agilent suggests creating your own normalization Probe Group. Note that Feature Extraction does not use the normalization Probe Group by default. For information on how to use the normalization Probe Group for normalization in Feature Extraction, refer to the section “View or change grid template properties” and follow the directions in “Change the default DyeNorm gene list” under “Browse file” in the Feature Extraction Software User Guide.
Replicate probes are used to calculate the QC metric Reproducibility. This metric is set to the median percent CV of background-subtracted signal for these replicate probes after outlier rejection. High scores for the Reproducibility metric usually indicate that the hybridization volume was too low or that the oven stopped rotating during the hybridization. The minimum number of replicated probes should be >= 300 probes replicated five times. This is because Feature Extraction requires a minimum three times replication level after rejection of feature non-uniformity outliers (FNUOL). The default Agilent replicate Probe Group for the 1x244 K and 1x1 M CGH microarrays contains 1000 probes and should be replicated five times. The 1000 probes are a random selection from catalog arrays.
Blanks are not recommended, because Autogridding in Feature Extraction will become problematic. If the design you have selected does not fill the array, the following are Agilent recommended options, ordered by preference:
1. Choose a smaller array format.
2. Replicate all probes on the microarray.
3. Fill array using an Agilent catalog Probe Group.
Also, if you prefer to increase the density of probes in the targeted genomic intervals, note that this will lead to the addition of probes that have lower scores. See FAQ “How many CGH probes and what density do I need to target a given genomic region?” (under "Creation of Probe Groups," above) for more details.
How do I make reverse-complement CGH probes, and are they better than straight replicates?
There is currently no option in eArray that enables the selection of reverse-complement probes; please contact your local Agilent sales representative about the Custom Microarray Design Services. We do not have data indicating whether reverse-complement probes would perform better or worse.
What resources can I use to obtain coordinates for all known CNVs?
Commonly used CNV databases are:
Database of Genomic Variants (DGV), hosted by the Hospital for Sick Children in Toronto
Copy Number Variation Project, developed by CHOP (Children’s Hospital of Philadelphia) and the University of Pennsylvania
Wellcome Trust Sanger Institute’s DECIPHER (Database of Chromosomal Imbalance and Phenotype in Humans using Ensembl Resources)
How can I visualize my CGH probe distribution against other genomic entities?
You can load your regions of interest and probes in the UCSC genome browser by downloading the .bed files from eArray.
On the eArray home page, click on “QuikScan Start Tutorials” for a detailed tutorial.
When I do probe design, why do I get back the same probe for different target sequences?
Ideally, the eArray probe design algorithms select unique probes for each input target sequence. However, they provide a "shared" probe if no other unique probes are available. This often occurs if two or more sequences within the target sequence set are overall very similar to each other, or are similar/identical in the region of the transcript from which candidate probes are selected (3' bias).
How do I search for the probes that I have designed with the GE Probe Design tool?
When you use the GE Probe Design tool to create probes, eArray saves the probes in files that you can download, sort, and analyze. However, you must save the probes as a probe group before eArray commits them to the database, and makes them searchable.
eArray clusters identical and highly homologous sequences before it designs probes. See How does GE Probe Design handle highly homologous sequences.
How does transcriptome selection affect design?
eArray's ability to design probes that are specific for each of the transcripts in your target set depends on how well your chosen transcriptome is characterized. Similar results are also observed if ESTs or predicted genes comprise the majority of transcripts in your target transcriptome. In other words, you should select the reference sequence that best represents what is in your DNA sample.